Math Tool

Statistics Calculator

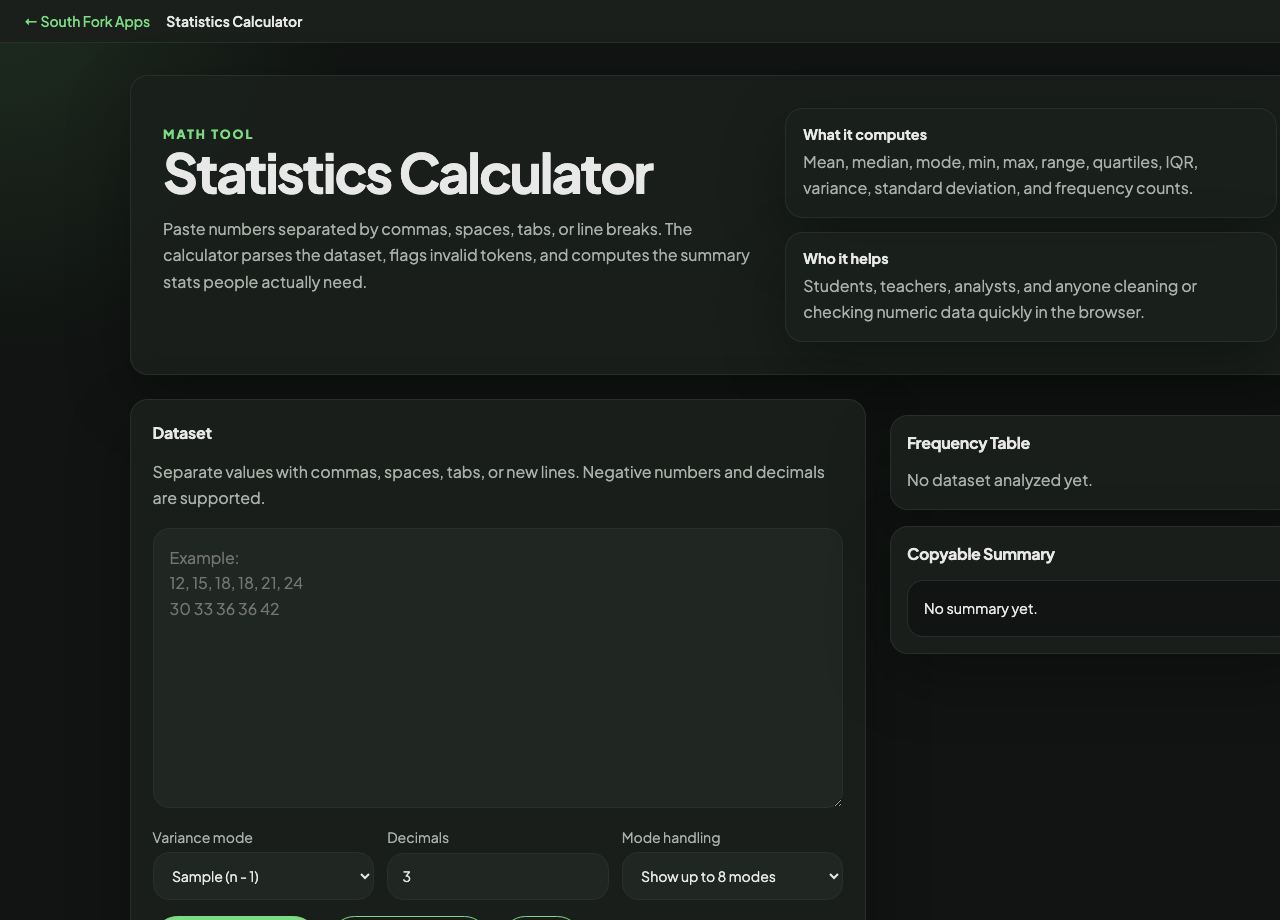
Paste numbers separated by commas, spaces, tabs, or line breaks. The calculator parses the dataset, flags invalid tokens, and computes the summary stats people actually need.

What it computes Mean, median, mode, min, max, range, quartiles, IQR, variance, standard deviation, and frequency counts.
Who it helps Students, teachers, analysts, and anyone cleaning or checking numeric data quickly in the browser.

Dataset

Separate values with commas, spaces, tabs, or new lines. Negative numbers and decimals are supported.

Sample Sets

Ready. Paste a dataset and click Analyze Dataset.

Frequency Table

No dataset analyzed yet.

Copyable Summary

No summary yet.
About this tool

Statistics Calculator

Statistics Calculator computes mean, median, mode, range, variance and standard deviation from a pasted dataset, with a choice of sample or population variance and configurable decimal places.

How to use it

  1. Paste your dataset.
  2. Choose sample or population variance.
  3. Set the decimals and mode handling.
  4. Read the full summary.

Sample or population, and why it matters

Population variance divides by n. Sample variance divides by n minus 1, which is Bessel's correction. The correction exists because a sample's own mean sits closer to its data than the true population mean does, which systematically underestimates the spread.

Pick sample when your data is a subset you are using to infer something about a larger group, which is almost always the case in practice. Pick population only when your data genuinely is everything you care about. On small datasets the difference is substantial.

When it helps

  • Summarising a dataset without opening a spreadsheet.
  • Checking a calculation done elsewhere.
  • Understanding spread, not just the average.
  • Teaching or learning descriptive statistics.

Common mistakes

  • Using population variance for sample data, which understates the spread.
  • Reporting the mean alone. A mean with no measure of spread hides everything interesting about the data.
  • Using the mean on skewed data, where the median describes the typical value far better.
Statistics Calculator interface preview
Screenshot of the live Statistics Calculator interface.